Real brands. Real marketplace growth.
Amazon and TikTok Shop accounts we manage across North America, the UK, and Europe. Every engagement starts the same way — a free audit, then a roadmap.
01
Amazon · North America & BrazilDominating North American Conversions
Client: An Australian-Based Global E-commerce Brand · Market: North America (US, CA, MX) & Brazil
The Challenge: Expanding an Australian-registered business into the highly saturated North American and South American Amazon markets. The primary hurdle was not just driving traffic, but ensuring that the traffic converted into actual sales against established local competitors.
The Strategy: To maximize return on ad spend and capitalize on organic traffic, the business focused heavily on listing optimization, high-quality media, and aggressive pricing strategies designed to convert browsers into buyers instantly.
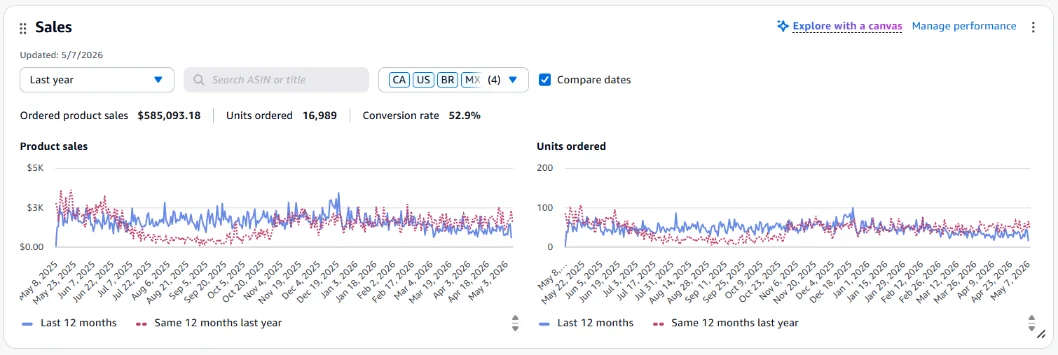
The Results (May 8, 2025 – May 7, 2026): The account achieved a staggeringly high conversion rate, indicating exceptional product-market fit and highly targeted traffic generation.
$585k
Total ordered product sales
16,989
Total units ordered
02
Amazon · United KingdomSustained Multi-Million Pound Scaling in the UK
Client: A Scaling Multi-National Retailer · Market: United Kingdom (UK)
The Challenge: After achieving initial success in the UK, the brand needed to sustain its momentum over a multi-year period. Scaling from a six-figure to a seven-figure annual run rate requires robust supply chain management, inventory forecasting, and impeccable customer service to protect account health.
The Strategy: The team transitioned to a high-volume fulfillment model, ensuring constant stock availability for their 158 active products. They also prioritized post-purchase customer journeys to build a strong brand reputation and seller feedback score.
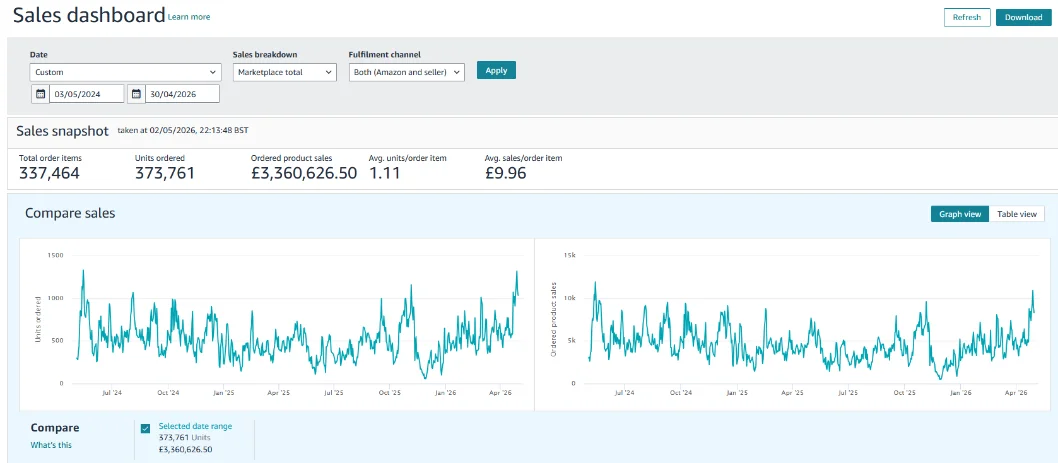
The Results (May 2024 – May 2026): The business successfully maintained seven-figure yearly revenues while keeping their seller metrics in excellent standing.
£3M+
2-year total revenue (May '24 – Apr '26)
373,761
Total units moved over 2 years
£1.5M+
12-month revenue (May '25 – May '26), 179,415 units
4.9 / 5
Customer satisfaction across 355 ratings in the past year
03
Amazon · United KingdomSmashing Year-Over-Year Monthly Records
Client: A High-Growth Amazon Seller · Market: United Kingdom (UK)
The Challenge: Beating previous historical sales records can be difficult as a brand matures. The goal for early Q2 2026 was to significantly outperform the same period in 2025 despite changing market conditions and rising ad costs.
The Strategy: By leveraging historical sales data, the team accurately forecasted April demand, allowing them to optimize their fulfillment channels (a mix of Amazon and seller fulfillment) and increase their Average Order Value (AOV).
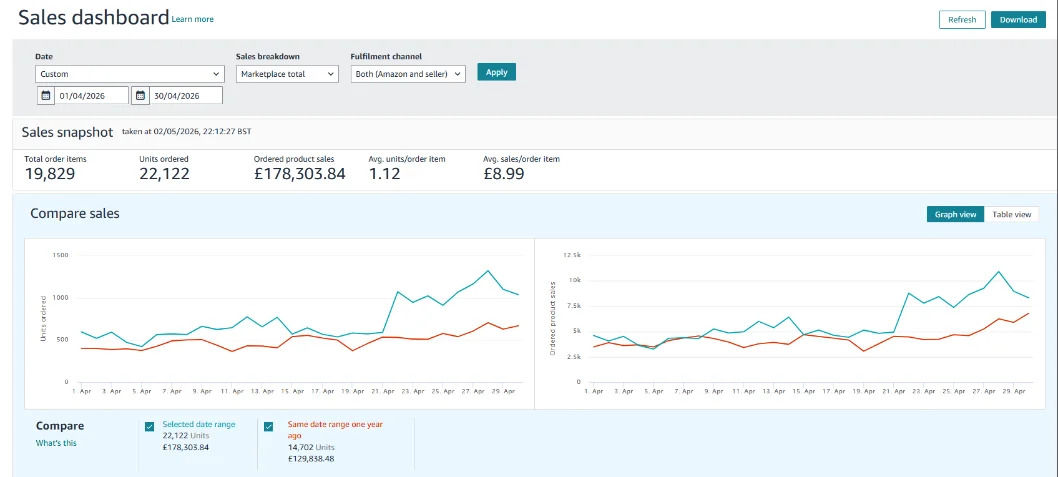
The Results (April 2025 vs. April 2026): The brand experienced explosive year-over-year growth for the month of April, significantly increasing both unit volume and total revenue.
£150k+
April 2026 sales — 22,122 units
£129,838
April 2025 sales — 14,702 units
+37.3%
YoY gross revenue growth, with a 50.4% increase in unit volume
04
Amazon · Europe & UKMaintaining Elite Account Health During High-Volume Sprints
Client: A High-Volume E-commerce Brand · Market: Europe / UK
The Challenge: Moving over 16,000 units in a single month places massive stress on a seller's account health. High defect rates, late shipments, or customer complaints can easily lead to account suspension during these high-volume sprints.
The Strategy: The business closely monitored its Inventory Performance Index (IPI) and proactively managed 740 open orders. They ensured that they maintained competitive pricing to hold onto the Featured Offer (Buy Box) while quickly resolving any customer inquiries to protect their rating.
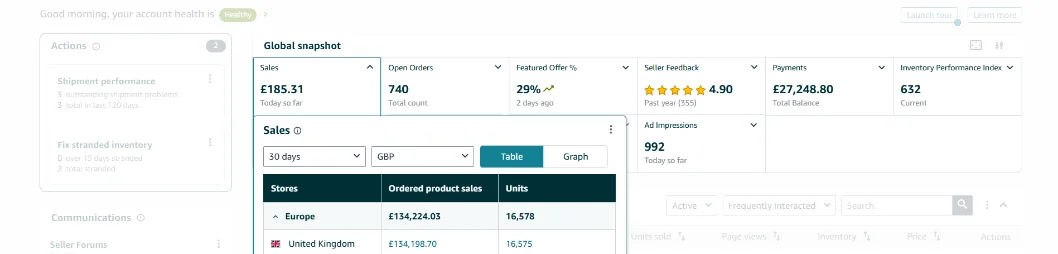
The Results (30-Day Rolling Snapshot in 2026): Despite the high volume of transactions, the account remained in perfect standing, generating strong cash flow.
£134,224.03
30-day European sales — 16,578 units
Healthy
Account status, with a pending payout balance of £27,248.80
05
Amazon PPCAggressive PPC Scaling and ROAS Stabilization During High-Traffic Periods
Client: A High-Volume E-commerce Brand · Market: Amazon (Generic)
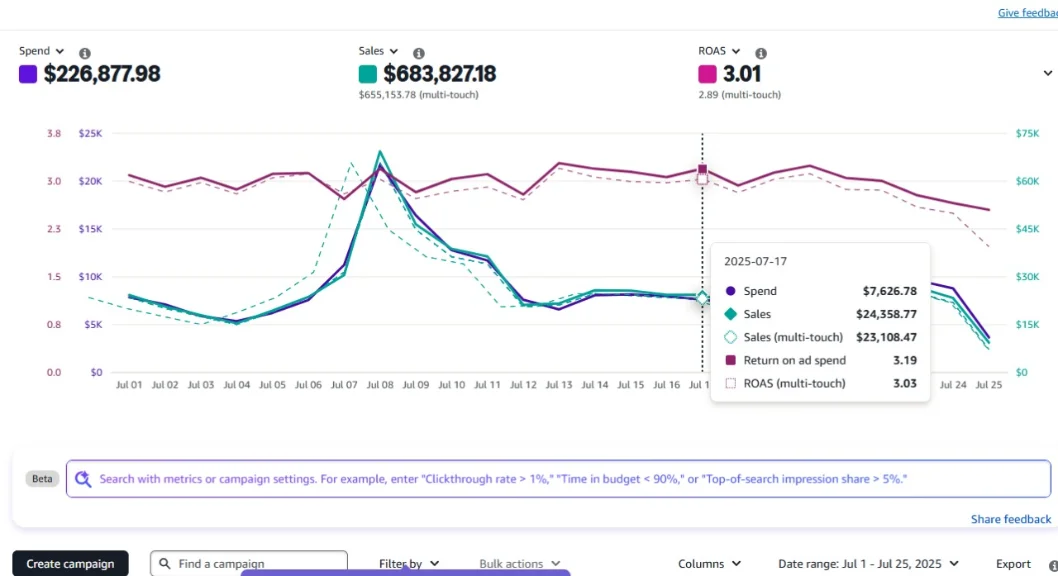
The Challenge: The objective was to aggressively scale ad spend to capture a mid-month traffic surge (peaking around July 8) without allowing the Return on Ad Spend (ROAS) to drop below 3.0. The strategy involved an aggressive visibility push during the peak event, followed by strict bid stabilization to maintain long-term profitability.
The Results (July 1 – July 25, 2025):
Peak Event Push (July 1–11): Generated $342,893 in ad sales from $113,863 in spend, driving over 24.6 million impressions to capitalize on the July 8 traffic spike.
Total Monthly Performance (25 Days): Scaled to $683,827.18 in total ad sales from $226,877.98 in ad spend.
Profitability Maintained: Successfully stabilized the account post-surge, holding a strong overall 3.01 ROAS.
Turning views into sales.
06
TikTok Shop · USExplosive Annual Growth via Short-Form Video Commerce
Client: A Fast-Growing TikTok E-commerce Brand · Market: TikTok Shop (US)
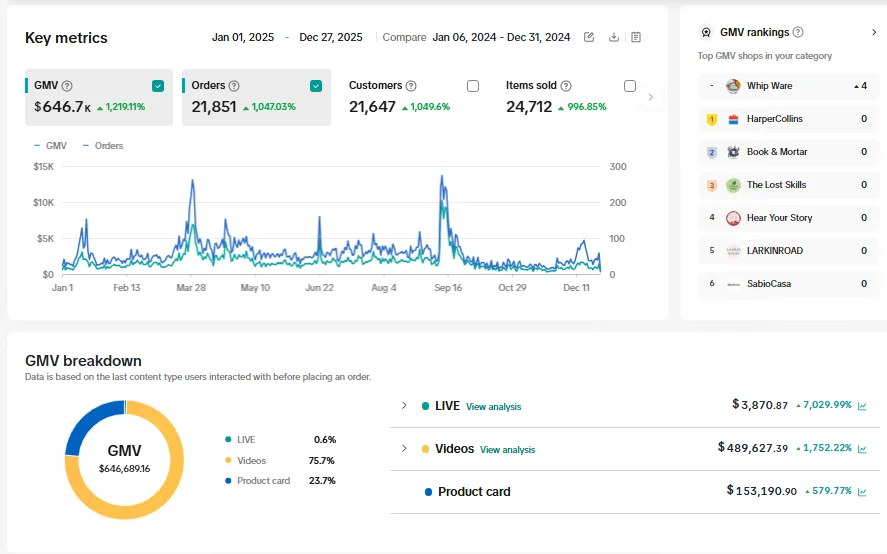
The Challenge: Transitioning an emerging brand from low-volume sales into a high-converting, sustained revenue engine over a 12-month period. The primary hurdle was shifting the audience from passive viewers to active buyers without heavily relying on expensive livestreaming setups.
The Strategy: The brand leaned almost entirely into short-form video content, prioritizing viral shoppable videos to drive impulse purchases. They systematically optimized their in-video product links and focused on organic reach rather than high-production LIVEs.
The Results (Jan 1, 2025 – Dec 27, 2025): The account achieved massive year-over-year growth, effectively scaling their operations by over 1,200%.
$646,689.16
Annual GMV, +1,219.11% YoY
21,851
Total orders, +1,047.03% YoY
75.7%
Of revenue ($489,627.39) generated directly from short-form videos
07
TikTok ShopHybrid Revenue Scaling: Creator Affiliates vs. Organic Product Cards
Client: An Established TikTok Shop Retailer · Market: TikTok Shop
The Challenge: The brand needed to diversify its revenue streams to avoid over-reliance on a single traffic source. While creator affiliates were driving sales, the brand wanted to capture more high-intent organic search traffic directly through their store catalog.
The Strategy: The team implemented a dual-engine approach. First, they aggressively seeded products to the TikTok Creator Affiliate network. Second, they heavily optimized their Seller Center listings (SEO, pricing, and imagery) to maximize algorithmic recommendation traffic via "Product Cards."
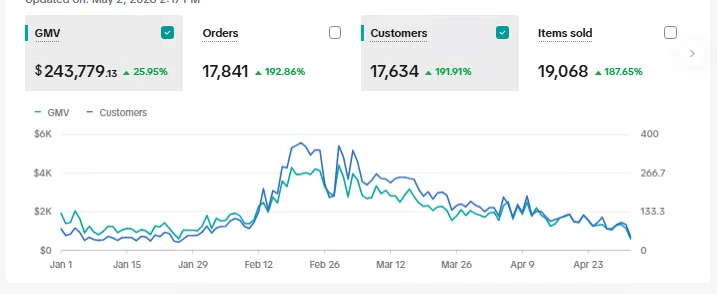
The Results (Year-to-Date: Jan 1 – May 2, 2026): The strategy created a perfectly balanced, highly profitable ecosystem where organic search matched affiliate outreach.
$243,779.13
Total YTD GMV
17,841
Total orders, +192.86% YoY
47.4%
Creator contribution ($115,592.54), driven predominantly by creator-made videos
52.6%
Seller contribution ($128,186.59), almost entirely from optimized organic Product Cards
08
TikTok ShopHyper-Growth Monthly Blitz and Traffic Funneling
Client: A Trending Consumer Goods Brand · Market: TikTok Shop
The Challenge: Capitalizing on a sudden spike in algorithmic favorability. When a product begins to trend on TikTok, the challenge shifts from generating awareness to successfully funneling massive surges of traffic into a frictionless checkout process before the trend dies down.
The Strategy: During a critical 30-day window, the brand focused entirely on inventory availability, rapid fulfillment turnarounds, and reducing friction on their product detail pages to convert a massive influx of unique store visitors.
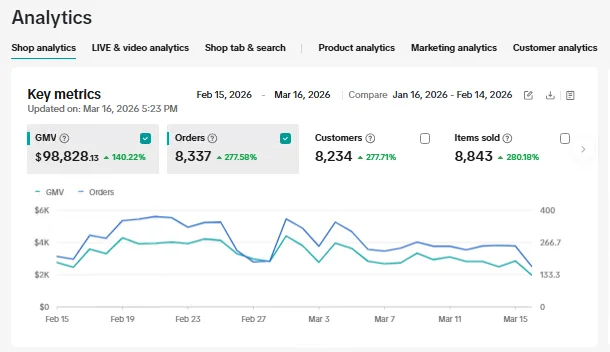
The Results (Feb 15, 2026 – Mar 16, 2026): The brand successfully captured the viral momentum, dramatically increasing month-over-month conversions.
$98,828.13
30-day GMV, +140.22% MoM
8,337
Total orders, +277.58% MoM
735,945
Store visitors funneled and converted
09
TikTok Shop · Paid adsHigh-Efficiency Paid Ad Scaling (GMV Max)
Client: A Niche E-commerce Seller · Market: TikTok Shop
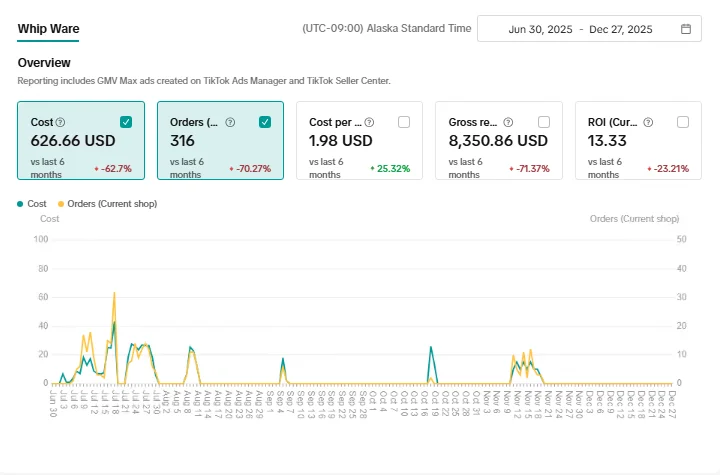
The Challenge: Scaling paid user acquisition on TikTok without burning through capital. The brand needed to test TikTok's ad network (specifically GMV Max campaigns) to acquire customers profitably on a strict, limited budget.
The Strategy: Instead of broad brand-awareness campaigns, the seller utilized highly targeted GMV Max ads designed strictly for direct-response conversions. They maintained strict cost-caps to ensure they only paid for high-intent traffic.
The Results (6-Month Period: Jun 30, 2025 – Dec 27, 2025): The account achieved exceptional advertising efficiency, turning a micro-budget into measurable gross revenue.
$626.66
Total ad spend
$8,350.86
Gross ad revenue
$1.98
Cost per order
13.33
Return on investment — effectively a 1,333% ROAS